คือเราจะไปสอบ ielt วันเสาร์ละเลย ฮึดขึ้นมาฝึกเขียนหน่อย 555555
ไม่ทราบว่าควรแท็กห้องไหนบ้าง ถ้าผิดก็ขอโทษด้วยนะคะ
ผิดถูกควรเติมหรือแก้ตรงไหนช่วยชี้แนะด้วยนะค้าาา
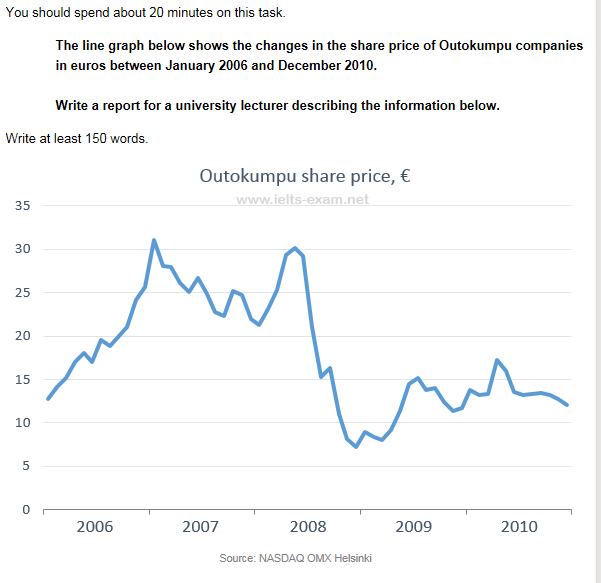
The line graph shows the changes in share price of Outokumpu companies in euros between January 2006 and December 2010.
The x axis is used to represent the time range from 2006 to 2010 and y axis for an amount of share price. The beginning of this period the share price was at EUR 13 and tended to increase but there were several fluctuations. In the late 2006, the share price was strongly rising up from EUR20 to the peak at EUR31 per share. After the peak in the early 2007, the share price trend tended to decrease continuously to EUR21 per share, however, it started to increase again in 2008. The upward trend didn’t last very long, since the graph turned downward sharply to the trough of the graph at the share price of EUR 7. After that, the price stated to recover with some fluctuations then reaches EUR 17 in the mid-2010. After the mid-2010, the trend was downward again to the end of the year at EUR13.
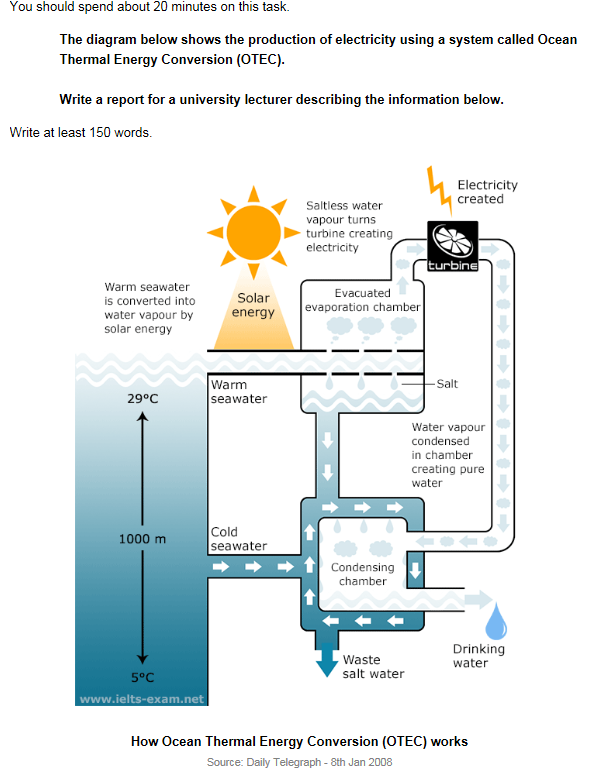
Ocean Thermal Energy Conversion (OTEC) is a system that converts the heat energy in to an electrical energy. The temperature between the surface area of the water and the temperature in the deeper part are used to operate the system.
This system is creating two beneficial productions which are drinking water and electricity. The main component used in this system is water evaporation. The warm seawater from the surface area of the sea is likely to be evaporated faster than cold seawater as its temperature is higher. The warm seawater is heated up by the sun or also known as solar energy. When it is evaporated, there will be salt left. The left over salt is release to a separate tube which connected to a cold seawater. The cold seawater is used to cool down the condensing chamber. The water vapour moves through the tube to a condensing chamber, where the water vapour is condensed then become unsalted water of drinking water.
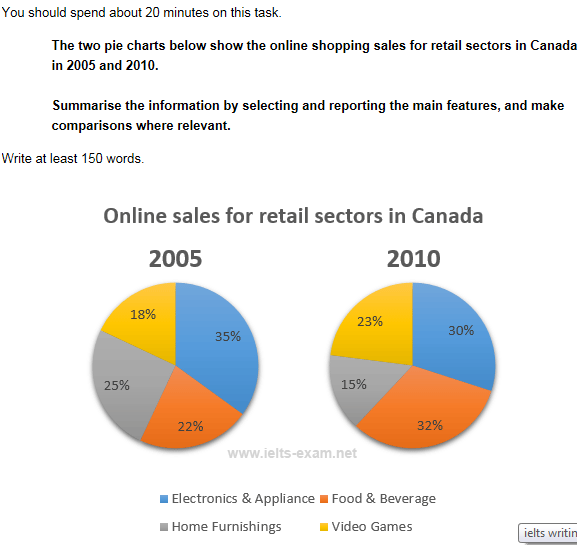
There are two pie charts showing the online shopping sales for retail sectors in Canada on 2005 and 2010. The two charts are showing the sales in percentage of the years 2005 and 2010.
In 2005, the sales of electronics and appliance is 35% which is the major sector of the 2005 chart, where as in 2010, the major sector is food and beverage with the sales of 32%. In 2005, video games are the minor sectors with the sales of 18%, however, across a 5-year period of time, the sales had increased to 23%. Meanwhile, the number of people purchasing home furnishing online had decreased from 25% in 2005 to 15% in 2010 which is the biggest sales drop of all. The largest increasing sector is food and beverage as it increased by 10%, from 22% to 32%. Eventually, the sales of video games over took the sales of home furnishings while electronics appliance remained similar with only 5% sale dropped.

ช่วยให้ความเห็น Ielt writting - academic ที่ลองเขียนหน่อยค่าา
ไม่ทราบว่าควรแท็กห้องไหนบ้าง ถ้าผิดก็ขอโทษด้วยนะคะ
ผิดถูกควรเติมหรือแก้ตรงไหนช่วยชี้แนะด้วยนะค้าาา
The line graph shows the changes in share price of Outokumpu companies in euros between January 2006 and December 2010.
The x axis is used to represent the time range from 2006 to 2010 and y axis for an amount of share price. The beginning of this period the share price was at EUR 13 and tended to increase but there were several fluctuations. In the late 2006, the share price was strongly rising up from EUR20 to the peak at EUR31 per share. After the peak in the early 2007, the share price trend tended to decrease continuously to EUR21 per share, however, it started to increase again in 2008. The upward trend didn’t last very long, since the graph turned downward sharply to the trough of the graph at the share price of EUR 7. After that, the price stated to recover with some fluctuations then reaches EUR 17 in the mid-2010. After the mid-2010, the trend was downward again to the end of the year at EUR13.
Ocean Thermal Energy Conversion (OTEC) is a system that converts the heat energy in to an electrical energy. The temperature between the surface area of the water and the temperature in the deeper part are used to operate the system.
This system is creating two beneficial productions which are drinking water and electricity. The main component used in this system is water evaporation. The warm seawater from the surface area of the sea is likely to be evaporated faster than cold seawater as its temperature is higher. The warm seawater is heated up by the sun or also known as solar energy. When it is evaporated, there will be salt left. The left over salt is release to a separate tube which connected to a cold seawater. The cold seawater is used to cool down the condensing chamber. The water vapour moves through the tube to a condensing chamber, where the water vapour is condensed then become unsalted water of drinking water.
There are two pie charts showing the online shopping sales for retail sectors in Canada on 2005 and 2010. The two charts are showing the sales in percentage of the years 2005 and 2010.
In 2005, the sales of electronics and appliance is 35% which is the major sector of the 2005 chart, where as in 2010, the major sector is food and beverage with the sales of 32%. In 2005, video games are the minor sectors with the sales of 18%, however, across a 5-year period of time, the sales had increased to 23%. Meanwhile, the number of people purchasing home furnishing online had decreased from 25% in 2005 to 15% in 2010 which is the biggest sales drop of all. The largest increasing sector is food and beverage as it increased by 10%, from 22% to 32%. Eventually, the sales of video games over took the sales of home furnishings while electronics appliance remained similar with only 5% sale dropped.