ขอสอบถามพี่ๆ ครับ ผม pivotable ด้วย python อยากอยาก combind กราฟ N3,NB,D11 ให้มันเป็น total =2 ในแกนเดียวกัน แบบ CEN WB D11 ครับ
Code ใต้รูปถาพครับ
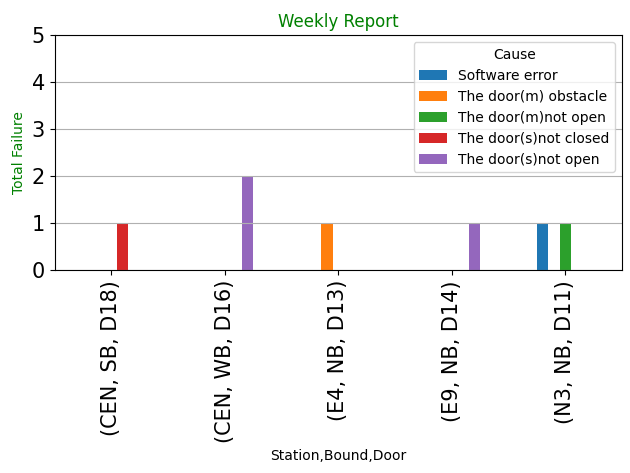
def pivot_table_1():
try:
df =pd.read_sql_query("SELECT * FROM weeklytable",conn,)
del df['Work']
del df['ID']
df.pivot_table(index=['Station','Bound','Door'], columns ='Cause',values='QTY', aggfunc='count',fill_value=0,
margins=False, margins_name='Grand Total').plot(kind='bar',fontsize=15)
plt.title('Weekly Report',color='green')
plt.ylabel('Total Failure',color='green')
plt.ylim(0,5)
plt.grid(axis = 'y')
plt.show()
except Exception as e:
messagebox.showerror('ERROR','ไม่มีข้อมูลในตาราง')
Py_Initialize()

Python
Code ใต้รูปถาพครับ
def pivot_table_1():
try:
df =pd.read_sql_query("SELECT * FROM weeklytable",conn,)
del df['Work']
del df['ID']
df.pivot_table(index=['Station','Bound','Door'], columns ='Cause',values='QTY', aggfunc='count',fill_value=0,
margins=False, margins_name='Grand Total').plot(kind='bar',fontsize=15)
plt.title('Weekly Report',color='green')
plt.ylabel('Total Failure',color='green')
plt.ylim(0,5)
plt.grid(axis = 'y')
plt.show()
except Exception as e:
messagebox.showerror('ERROR','ไม่มีข้อมูลในตาราง')
Py_Initialize()