เราพยายามทำความเข้าใจวิธีการสร้าง plot จาก link นี้
scikit-learn: plot_partial_dependence
แต่ก็ยังไม่เข้าใจว่า feature กับ target คืออะไรกันแน่ จากที่ดู code ตัวอย่าง feature จะเป็น list ของ integer หรือ string เช่น [0, 5, 1, 2, (5, 1)] หรือ ['MedInc', 'AveOccup', 'HouseAge', 'AveRooms', ('AveOccup', 'HouseAge')] แต่เราไม่เข้าใจว่าสรุปมันแค่ชื่อ feature หรือเป็น data ใน feature นั้น?
- คำว่า feature ในที่นี้หมายถึง independent variable รึเปล่า? ถ้าใช่แล้วมันต่างจาก X ยังไง? แล้วทำไม data ใน faetures ถึงเป็น float ไม่ได้ เพราะเราต้องการ plot ระหว่างค่าที่มันเป็นจุดทศนิยม เราไม่สามารถเปลี่ยน data type ให้เป็น integer ได้ เพราะค่ามันจะกลายเป็นแค่ 0, 1, 2 ซึ่งไม่ใช่ค่าที่แท้จริง
- กรณีที่ model ของเราเป็น multiclass classification เราต้องกำหนด target ด้วย target ในที่นี้คือ y (dependent variable) ใช่หรือไม่?
นี่คือ code สำหรับ random forest model ของเรา
[Spoil] คลิกเพื่อดูข้อความที่ซ่อนไว้from sklearn.model_selection import train_test_split
x = features
y = outcomes
x_train, x_test, y_train, y_test = train_test_split(x, y, test_size=0.25)
from sklearn.ensemble import RandomForestClassifier
clf = RandomForestClassifier(n_estimators=100, random_state=0)
clf.fit(x_train, y_train)
y_pred = clf.predict(x_test)
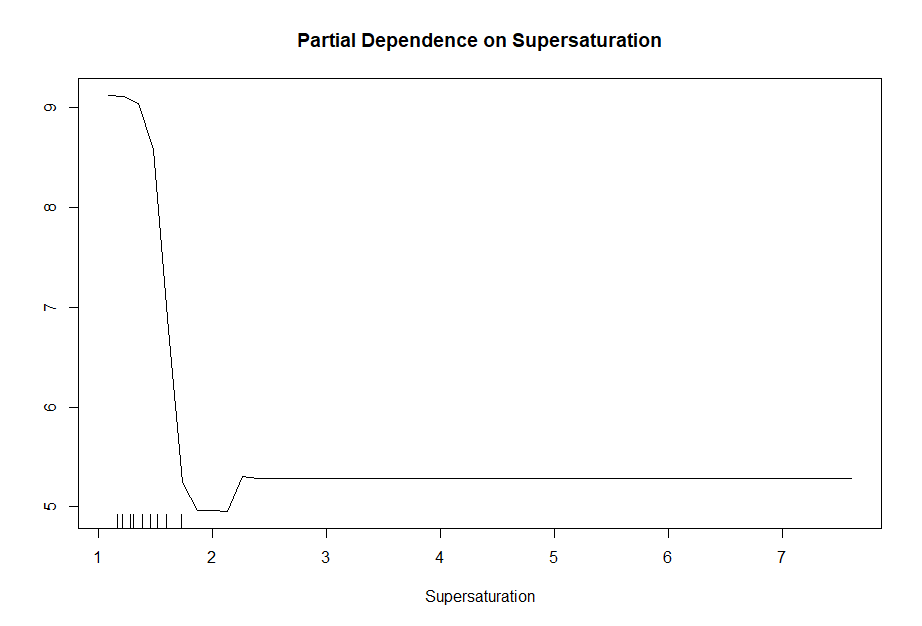
ที่นี้เราต้องการสร้าง partial dependence plot ระหว่าง data ใน variable SS ต่อ target 'Plates'
เรา run code นี้ แต่มันโชว์ว่า TypeError: 'float' object is not iterable
from sklearn.inspection import plot_partial_dependence
features = Dataset2['SS']
plot_partial_dependence(clf, x, features, target='Plates')
นี่คือสิ่งที่เราต้องการค่ะ ประมาณนี้ แต่ยังไงก็ไม่เข้าใจ ไม่รู้จะแก้ code ยังไงดี ใครทราบขอความกรุณาด้วยนะคะ เพิ่งเริ่มศึกษาค่ะ run ไม่ออกสักที หงุดหงิดจะตายแล้ว


ถามเรื่อง code สำหรับ partial dependence plot ใน Python หน่อยค่ะ
scikit-learn: plot_partial_dependence
แต่ก็ยังไม่เข้าใจว่า feature กับ target คืออะไรกันแน่ จากที่ดู code ตัวอย่าง feature จะเป็น list ของ integer หรือ string เช่น [0, 5, 1, 2, (5, 1)] หรือ ['MedInc', 'AveOccup', 'HouseAge', 'AveRooms', ('AveOccup', 'HouseAge')] แต่เราไม่เข้าใจว่าสรุปมันแค่ชื่อ feature หรือเป็น data ใน feature นั้น?
- คำว่า feature ในที่นี้หมายถึง independent variable รึเปล่า? ถ้าใช่แล้วมันต่างจาก X ยังไง? แล้วทำไม data ใน faetures ถึงเป็น float ไม่ได้ เพราะเราต้องการ plot ระหว่างค่าที่มันเป็นจุดทศนิยม เราไม่สามารถเปลี่ยน data type ให้เป็น integer ได้ เพราะค่ามันจะกลายเป็นแค่ 0, 1, 2 ซึ่งไม่ใช่ค่าที่แท้จริง
- กรณีที่ model ของเราเป็น multiclass classification เราต้องกำหนด target ด้วย target ในที่นี้คือ y (dependent variable) ใช่หรือไม่?
นี่คือ code สำหรับ random forest model ของเรา
[Spoil] คลิกเพื่อดูข้อความที่ซ่อนไว้
ที่นี้เราต้องการสร้าง partial dependence plot ระหว่าง data ใน variable SS ต่อ target 'Plates'
เรา run code นี้ แต่มันโชว์ว่า TypeError: 'float' object is not iterable
from sklearn.inspection import plot_partial_dependence
features = Dataset2['SS']
plot_partial_dependence(clf, x, features, target='Plates')
นี่คือสิ่งที่เราต้องการค่ะ ประมาณนี้ แต่ยังไงก็ไม่เข้าใจ ไม่รู้จะแก้ code ยังไงดี ใครทราบขอความกรุณาด้วยนะคะ เพิ่งเริ่มศึกษาค่ะ run ไม่ออกสักที หงุดหงิดจะตายแล้ว