
คำตอบที่ได้รับเลือกจากเจ้าของกระทู้
ความคิดเห็นที่ 1
Ranking Question
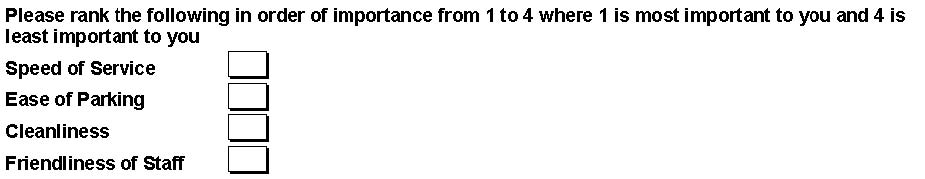
A ranking question on the other hand asks survey respondents to compare a list of different objects to one another (e.g. “Please rank each of the following items in order of importance with #1 being the most important object to #10 being the least important object.”). The example below uses a ranking scale of #1 to #4 where 1 is the most important and 4 is the least important.
sample
https://community.getfeedback.com/s/article/Understanding-the-Summary-Report
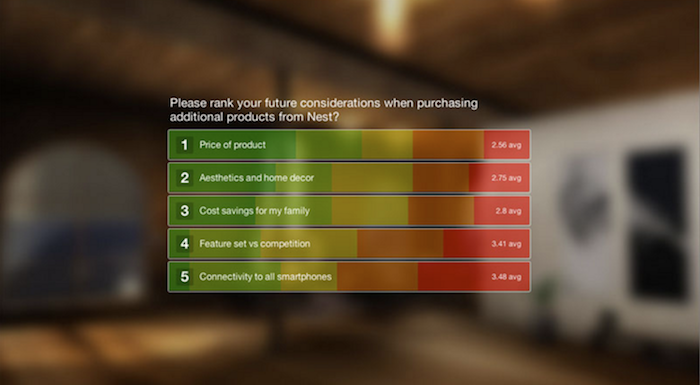 *The ranking question can be a little tricky to view in the Summary report. The average number you see is the average ranking of the choice. In the above example, everyone did not put that choice as #1, so the average position it was ranked it would be 2.56.
The colors then represent the percentage of total people who ranked that option in that place. For example, approximately 33% of people put Price of Product in the number one position. There will always be the same number of colors as there are choices.
A ranking question on the other hand asks survey respondents to compare a list of different objects to one another (e.g. “Please rank each of the following items in order of importance with #1 being the most important object to #10 being the least important object.”). The example below uses a ranking scale of #1 to #4 where 1 is the most important and 4 is the least important.
sample
https://community.getfeedback.com/s/article/Understanding-the-Summary-Report
*The ranking question can be a little tricky to view in the Summary report. The average number you see is the average ranking of the choice. In the above example, everyone did not put that choice as #1, so the average position it was ranked it would be 2.56.The colors then represent the percentage of total people who ranked that option in that place. For example, approximately 33% of people put Price of Product in the number one position. There will always be the same number of colors as there are choices.

แสดงความคิดเห็น
สถิติ Ranking Question การจัดอันดับ 1,2,3...ว่ามีวิธีวิเคราะห์ข้อมูลตามหลักวิชาการอย่างไร
มีวิธีคิด คำนวณยังไงค่ะ ตอนนี้ทำใน spss ใครพอมีวิธีบ้างค่ะ
ช่วยเค้าหน่อย