1.อยากทราบความแตกต่างระหว่า qq plot และ pp plot ว่าแตกต่างกันยังไงค่ะ
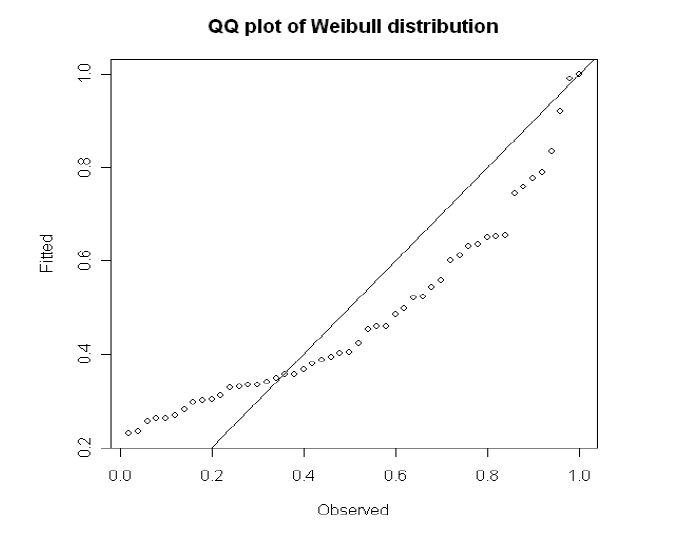
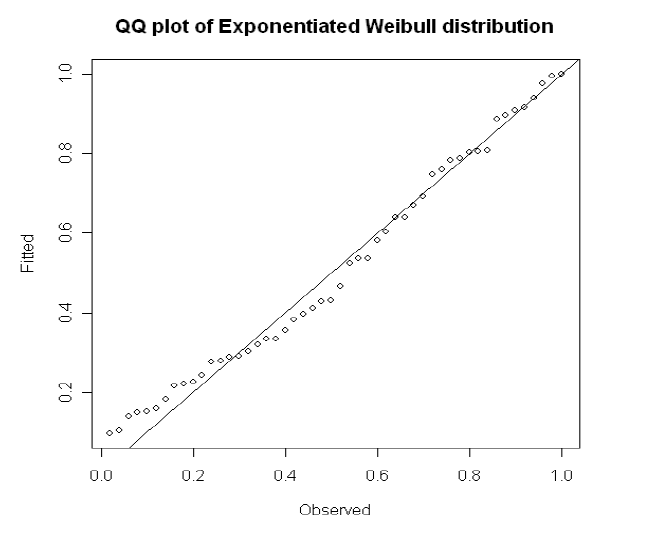
2.ช่วยอธิบายกราฟ 2 รูปนี้ให้ฟังหน่อยค่ะ พอดีหาจากข้างนอกแล้วมีแต่แบบ normal distribution
สงสัยว่าทำไม qq plot ของ Weibull จุดเริ่มต้นของเส้นอยู่ที่ 0.2 แต่ qq plot ของ Exponentiated Weibull เริ่มใกล้ๆ 0 คะ
ที่มารูป: งานวิจัยเรื่อง comparison of weibull distribution and exponentiated weibull distribution
based estimation of mean and variance of wind data
ขอบคุณค่ะ


อยากทราบความแตกต่าง qq plot กับ pp plot ค่ะ
2.ช่วยอธิบายกราฟ 2 รูปนี้ให้ฟังหน่อยค่ะ พอดีหาจากข้างนอกแล้วมีแต่แบบ normal distribution
สงสัยว่าทำไม qq plot ของ Weibull จุดเริ่มต้นของเส้นอยู่ที่ 0.2 แต่ qq plot ของ Exponentiated Weibull เริ่มใกล้ๆ 0 คะ
ที่มารูป: งานวิจัยเรื่อง comparison of weibull distribution and exponentiated weibull distribution
based estimation of mean and variance of wind data
ขอบคุณค่ะ