Q1 A study at Ulster University considered the correlation in fifteen SMEs between their abilities to carry out Continuous Improvement (CI) and their cultures of Innovation. For each of the fifteen firms a score was developed to indicate their capability in the two areas. The results are shown below:
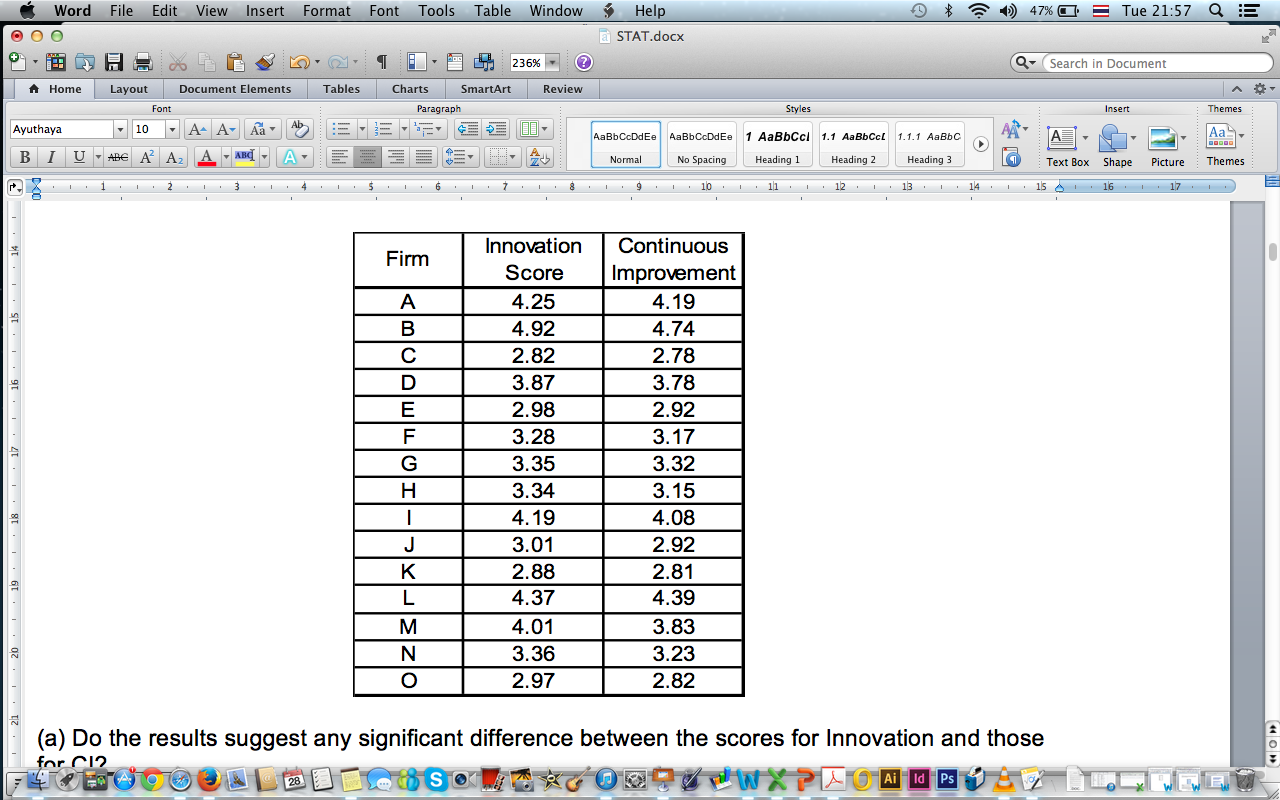
(a) Do the results suggest any significant difference between the scores for Innovation and those for CI?
(b) The authors of the report suggest that a firm’s ability to Innovate can be predicted from their capability in CI. Does the data support this suggestion?
(c) Comment on the findings in parts (a) and (b). Do your answers indicate any difficulty in interpreting the results of the study?
(d) If a firm had a CI score of 3.5 calculate the 95% confidence limits for their predicted score for Innovation.
(e) Test the hypothesis that the graph should pass through the origin (i.e. α = 0). Explain what this means in practical terms.


ต้องการความช่วยเหลือตีโจท statistic ค่ะ
(a) Do the results suggest any significant difference between the scores for Innovation and those for CI?
(b) The authors of the report suggest that a firm’s ability to Innovate can be predicted from their capability in CI. Does the data support this suggestion?
(c) Comment on the findings in parts (a) and (b). Do your answers indicate any difficulty in interpreting the results of the study?
(d) If a firm had a CI score of 3.5 calculate the 95% confidence limits for their predicted score for Innovation.
(e) Test the hypothesis that the graph should pass through the origin (i.e. α = 0). Explain what this means in practical terms.